

ECharts折线图实现部分虚线部分实线效果的方法
作者:资源驿站时间:2026-10-31 15:52:33浏览:105
本文介绍如何在ECharts折线图中实现部分实线、部分虚线的显示效果。通过修改series配置中的lineStyle.type属性,结合数据处理技巧,如使用占位符分隔数据段,可灵活控制线条样式。适用于预测数据或特殊业务场景的可视化需求。
场景:
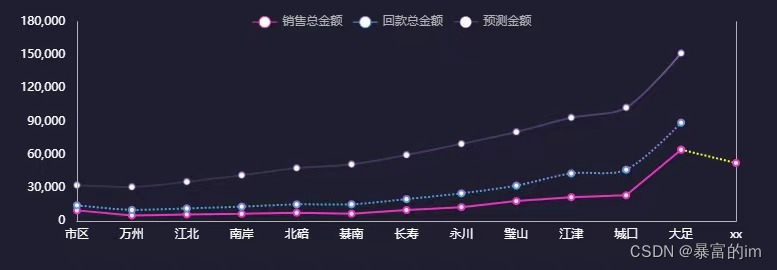
折线图通常以实线为主,但最后一个数据点为预测值时,需将最后一段线条设为虚线。
效果图:
具体实现:
series:[

        {
            name: "销售总金额",
            type: "line",
            smooth: true,
            barWidth: 10,
            stack: 'Total',
            itemStyle: {
              normal: {
                color: "#F02FC2",
                lineStyle: {
                  width: 2,
                  type: 'solid'  //'dotted'虚线 'solid'实线
                }
              },
              // 强调最后一个数据点的样式
            },
            data: [1213,232132,4324,2,23,42323,4234,4243223,424334,4324,423423,64456]

    PS:重点虚线的那一段的开头数据需要与实线的最后一个数据对应

          },
          {
            name: "销售总金额",
            type: "line",
            smooth: true,
            barWidth: 10,
            itemStyle: {
              normal: {
                color: "#F02FC2",
                // 最后一个点的边框颜色
                borderWidth: 2,
                lineStyle: {
                  width: 2,
                  type: 'dotted',
                  color: "yellow"//'dotted'虚线 'solid'实线
                }
              }
            },
            data: ["-", "-", "-", "-", "-", "-", "-", "-", "-", "-", "-", 64456, 52435]
          },

]
同理,若中间某段数据需显示为虚线,也可采用相同方法处理。
数据处理:
let dataValue = [1, 2, 3, 4, 5, 6];
let dataValue1 = [ ...new Array(dataValue.length - 1).fill('-'), dataValue[dataValue.length - 1]
多条线点重合的处理方法
防止多个点以及值为空的情况
 this.options = {
          tooltip: {
            trigger: "axis",
            backgroundColor: "rgba(255,255,255,0.8)",
            formatter: function (params, ticket, callback) {
              var htmlStr = '';
              var valMap = {};
              for (var i = 0; i < params.length; i++) {
                var param = params[i];
                var xName = param.name;//x轴的名称
                var seriesName = param.seriesName;//图例名称
                var value = param.value;//y轴值
                var color = param.color;//图例颜色

                //过滤无效值
                if (value == '-') {
                  continue;
                }

                //过滤重叠值
                if (valMap[seriesName] == value) {
                  continue;
                }

                if (i === 0) {
                  htmlStr += xName + '<br/>';//x轴的名称
                }
                htmlStr += '<div>';
                //为了保证和原来的效果一样,这里自己实现了一个点的效果
                htmlStr += '<span style="margin-right:5px;display:inline-block;width:10px;height:10px;border-radius:5px;background-color:' + color + ';"></span>';

                //圆点后面显示的文本
                htmlStr += seriesName + ':' + value;

                htmlStr += '</div>';
                valMap[seriesName] = value;
              }
              return htmlStr;
            },
            axisPointer: {
              type: "shadow",
              label: {
                show: true,
                backgroundColor: "#7B7DDC"
              }
            }
          },
          legend: {
            data: ["销售总金额", "回款总金额"],
            textStyle: {
              color: "#B4B4B4"
            },
            top: "0%"
          },
          grid: {
            left: '0%',
            right: '3%',
            bottom: '8%',
            width: "96%",
            containLabel: true
          },
          xAxis: {
            data: this.cdata.category,
            axisLine: {
              lineStyle: {
                color: "#B4B4B4"
              }
            },
            type: 'category',
            boundaryGap: true,
          },
          yAxis: [
            {
              splitLine: { show: false },
              axisLine: {
                lineStyle: {
                  color: "#B4B4B4"
                }
              },

              axisLabel: {
                formatter: "{value} "
              }
            },
            {
              splitLine: { show: false },
              axisLine: {
                lineStyle: {
                  color: "#B4B4B4"
                }
              },
              axisLabel: {
                formatter: "{value} "
              }
            }
          ],
          series: [
            {
              name: "销售总金额",
              type: "line",
              smooth: true,
              barWidth: 10,
              // stack: 'Total',  这个不去掉会出现多个点
              itemStyle: {
                normal: {
                  color: "#F02FC2",
                  lineStyle: {
                    width: 2,
                    type: 'solid'  //'dotted'虚线 'solid'实线
                  }
                },
                // 强调最后一个数据点的样式
              },
              data: this.cdata.rateData
            },
            {
              name: "销售总金额",
              type: "line",
              smooth: true,
              barWidth: 10,
              itemStyle: {
                normal: {
                  color: "#F02FC2",
                  // 最后一个点的边框颜色
                  // borderWidth: 2,
                  lineStyle: {
                    width: 2,
                    type: 'dotted',
                    // color: "yellow"//'dotted'虚线 'solid'实线
                  }
                }
              },
              data: this.cdata.mockRateData
            },
            {
              name: "回款总金额",
              type: "line",
              barWidth: 10,
              smooth: true,
              itemStyle: {
                normal: {
                  barBorderRadius: 5,
                  color: "#7e8be9",
                  lineStyle: {
                    width: 2,
                    type: 'solid'  //'dotted'虚线 'solid'实线
                  }
                }
              },
              data: this.cdata.barData  [1,2,3,4,'-']
            },
            {
              name: "回款总金额",
              type: "line",
              barWidth: 10,
              smooth: true,
              smooth: false,
              itemStyle: {
                normal: {
                  // barBorderRadius: 5,
                  color: "#7e8be9",
                  // color: "#7e8be9",
                  lineStyle: {
                    width: 2,
                    type: 'dotted'  //'dotted'虚线 'solid'实线
                  }
                }
              },
              data: this.cdata.mockBarData  ['-','-','-',4,5]
            },
          ]
        }
总结
到此这篇关于echarts折线图实现部分虚线部分实线效果的文章就介绍到这了,更多相关echarts折线图部分虚线内容请搜索本站以前的文章或继续浏览下面的相关文章希望大家以后多多支持本站!
作者最新文章
JS中使用位运算(~~)和一元加号(+)快速转换字符串为整数
2026-11-03 22:41:12
怎么使用命令行批量格式化项目中的JS文件
2026-11-03 19:04:42
JS代码美化后报错怎么办?常见格式化冲突解决方法
2026-11-03 18:47:01
不用moment.js,怎么用原生JS Intl API格式化时间戳
2026-11-03 18:10:30
原生JS与dayjs获取当前日期的代码对比
2026-11-03 17:57:26