

原生JS Canvas实现图形标注:矩形绘制与交互详解
本文详细讲解如何使用原生JavaScript和Canvas API实现图形标注功能。重点演示矩形的创建、绘制逻辑及鼠标交互处理,包括按下、移动和松开事件。通过封装Chart基类和Rectangle子类,实现图形的动态刷新、拖拽移动及边界检测,为多边形等其他图形扩展提供基础架构。
项目需求要求在视频或图片上实现图形标注功能,支持矩形、多边形、线段、圆形和折线等形状,且已绘制的图形需支持缩放和移动操作。
完整功能的源代码已托管在相关仓库,读者可自行克隆代码进行本地运行和测试。
接下来,通过一个Demo展示最基础的图形——矩形的创建过程。
初始化页面结构。
<!DOCTYPE html>
<html lang="en">
  <head>
    <meta charset="UTF-8" />
    <meta http-equiv="X-UA-Compatible" content="IE=edge" />
    <meta name="viewport" content="width=device-width, initial-scale=1.0" />
    <title>Document</title>

    <style>
      body {
        margin: 0;
        padding: 0;
        height: 100vh;
        display: flex;
        align-items: center;
        justify-content: center;
      }

      canvas {
        border: 1px solid saddlebrown;
        background-color: beige;
      }
    </style>
  </head>
  <body>
    <canvas id="canvasIdChart" class="canvas">您的浏览器不支持canvas1元素</canvas>
    <script src="./drawClass.js"></script>
    <script>
      const chart = new Chart('canvasIdChart')
    </script>
  </body>
</html>
页面仅包含一个Canvas元素,核心功能封装在drawClass模块中。这里定义了一个Chart类,初始化时需传入Canvas的ID,后续所有绘制操作均基于该Canvas实例进行。
创建基础类Chart。
首先梳理实现图形标注所需涉及的事件机制。
当用户在Canvas上按下鼠标时,表示开始绘制矩形,此时需绑定onmousedown事件。绘制过程涉及onmousemove事件,而鼠标松开表示绘制结束,对应onmouseup事件。此外,需考虑用户绘制过程中鼠标移出Canvas范围的情况,此时无法触发Canvas内部的onmouseup事件,因此需额外绑定onmouseout事件,鼠标移出即视为绘制完成。
初始化代码如下。
class Chart {
  constructor(canvasId) {
    this.cvs = document.getElementById(canvasId)
    this.ctx = this.cvs.getContext('2d')
    this.shapes = [] // 保存图形数据的数组
    this.init() // 初始化canvas得宽高
    this.bindEvent() // 为canvas绑定鼠标事件
    this.draw() // canvas的绘制
    this.isClickDown = false // 当前鼠标是否按下
    this.currentShape = null // 当前选中的图形
  }
  init() {
    const w = 1000,
      h = 600
    this.cvs.width = w
    this.cvs.height = h
  }
  bindEvent() {
    this.cvs.onmousedown = (e) => {
      this.isClickDown = true
			// 鼠标按下的时候创建其他鼠标事件
      that.cvs.onmousemove = function (e){}
      that.cvs.onmouseup = function (e){}
      that.cvs.onmouseout = function (e){}
    }
  }
  draw() {}
}
为便于后续扩展,将各类图形封装为独立类,例如矩形封装为class **Rectangle。这种设计使得我们只需规定图形类内部包含特定的属性和方法供Chart类的draw函数调用即可。例如,矩形的绘制逻辑可写在Rectangle类的draw函数中,而Chart中的draw只需调用new Rectangle().draw()。需要注意的是,draw方法需随mousemove事件不断刷新Canvas,此时建议使用requestAnimationFrame方法,让浏览器在合适时机调用draw函数。Chart的draw方法实现如下:
class Chart {
	....
	draw() {
    requestAnimationFrame(this.draw.bind(this))
    this.ctx.clearRect(0, 0, this.cvs.width, this.cvs.height) // 首先清空canvas
    // 将shapes里面的图形重新绘制
    for (const s of this.shapes) {
      s.draw()
    }
  }
}
实现Rectangle类。
首先明确矩形所需的几个关键要素。
- 填充颜色。
- 矩形的初始位置,即鼠标按下的坐标点。
- 矩形的终点位置,即鼠标抬起时的坐标点,也是鼠标移动结束时的位置。
- 绘制目标载体,即当前的Canvas对象。
- 若初始位置大于终点位置(如鼠标按下后向左上角绘制),可利用ES6 Class语法中的get方法获取minX、maxX、minY、maxY属性,确保坐标计算正确。
- 由于同一几何图形可能存在多个实例,每个实例需拥有唯一的ID。
初始代码如下:
/**
 * 生成唯一ID
 * @param {Number} length  生成id的长度
 * @returns
 */
const genID = (length = 3) => {
  return Number(Math.random().toString().substr(3, length) + Date.now()).toString(36)
}

class Rectangle {
  constructor(el,color, startX, startY) {
    this.el = el // 保存需要绘制的载体
    this.shapeType = 'RECT' // 当前几何图形的类别
    this.color = color // 填充的颜色
    // 初始化起点,默认起点和终点一样
    this.startX = startX
    this.startY = startY
    this.endX = startX
    this.endY = startY
    this.action = 'CREATE'  // 当前的操作类型
    this.id = genID() // 当前实例的唯一id
  }

  get minX() {
    return Math.min(this.startX, this.endX)
  }

  get maxX() {
    return Math.max(this.startX, this.endX)
  }

  get minY() {
    return Math.min(this.startY, this.endY)
  }

  get maxY() {
    return Math.max(this.startY, this.endY)
  }

  draw() {}
}
实现Rectangle类的draw函数。得益于Canvas API已提供绘制矩形的方法,无需手动逐线绘制。该方法为canvas.rect(startX,startY,width,height),四个参数分别为矩形起点的横纵坐标及宽高,这也解释了为何需要minX和minY属性。代码如下:
class Rectangle {
	...
	 draw() {
    this.el.beginPath()  // 画笔起始点
    this.el.rect(
      this.minX,
      this.minY,
      (this.maxX - this.minX),
      (this.maxY - this.minY)
    )
    this.el.fillStyle = this.color // 填充颜色
    this.el.fill()
    this.el.strokeStyle = '#fff' // 边框的颜色
    this.el.lineCap = 'square'
    this.el.lineWidth = 3 // 边框粗细
    this.el.stroke() // 画笔终点
  }
}
判断鼠标点击是否位于矩形内部,以此区分新建图形还是拖拽现有图形。判断坐标点是否落在矩形内部十分直观,只需对比minX、minY、maxX、maxY与传入的x、y坐标即可。
class Rectangle {
	...

  isInside(x, y) {
    return x >= this.minX && x <= this.maxX && y >= this.minY && y <= this.maxY
  }
}
实现鼠标事件处理。
获取鼠标坐标属性有多种方式,如clientX、screenX、offsetX等,具体差异可参考相关文档。本文采用offsetX,因其获取的是相对于事件对象(即Canvas)的位置。
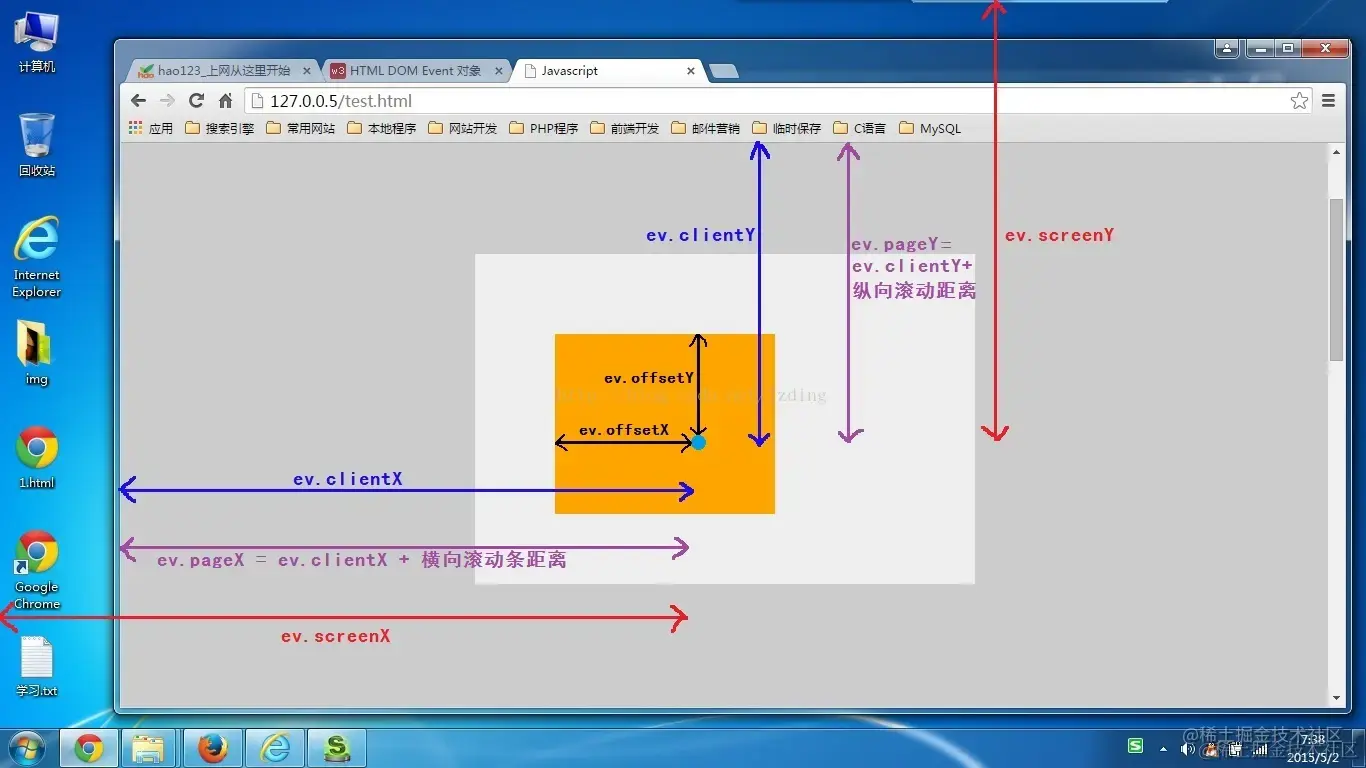
onmousedown事件处理。
在mousedown事件中需执行两项操作:判断鼠标落点是否在已有矩形内部,若在则执行拖拽逻辑,否则执行新建逻辑。判断是否落在图形集合内部,此前已在几何图形类中约定了isInside方法,此时只需遍历shapes数组,依次调用每一项的isInside方法即可。
...
// 遍历数组
getShapes(x, y) {
    for (let i = this.shapes.length - 1; i >= 0; i--) {
      const s = this.shapes[i]
      if (s.isInside(x, y)) {
        return s
      }
    }
    return null
  }
若返回null,则进入新建逻辑。新建矩形操作相对简单,即创建Rectangle实例,new Rectangle(...)并将新实例添加至shapes数组中。此时onmousemove事件也较为简单,只需将实例中的endX、endY更新为当前移动坐标即可。
// 新建
const shape = new Rectangle(that.ctx, '#f00', clickX, clickY)
that.shapes.push(shape)
that.cvs.onmousemove = function (e) {
  shape.endX = e.offsetX
  shape.endY = e.offsetY
}
若返回非null,说明找到了当前点击的图形,执行拖拽逻辑。拖拽需计算矩形移动的偏移量,具体逻辑如下图所示:
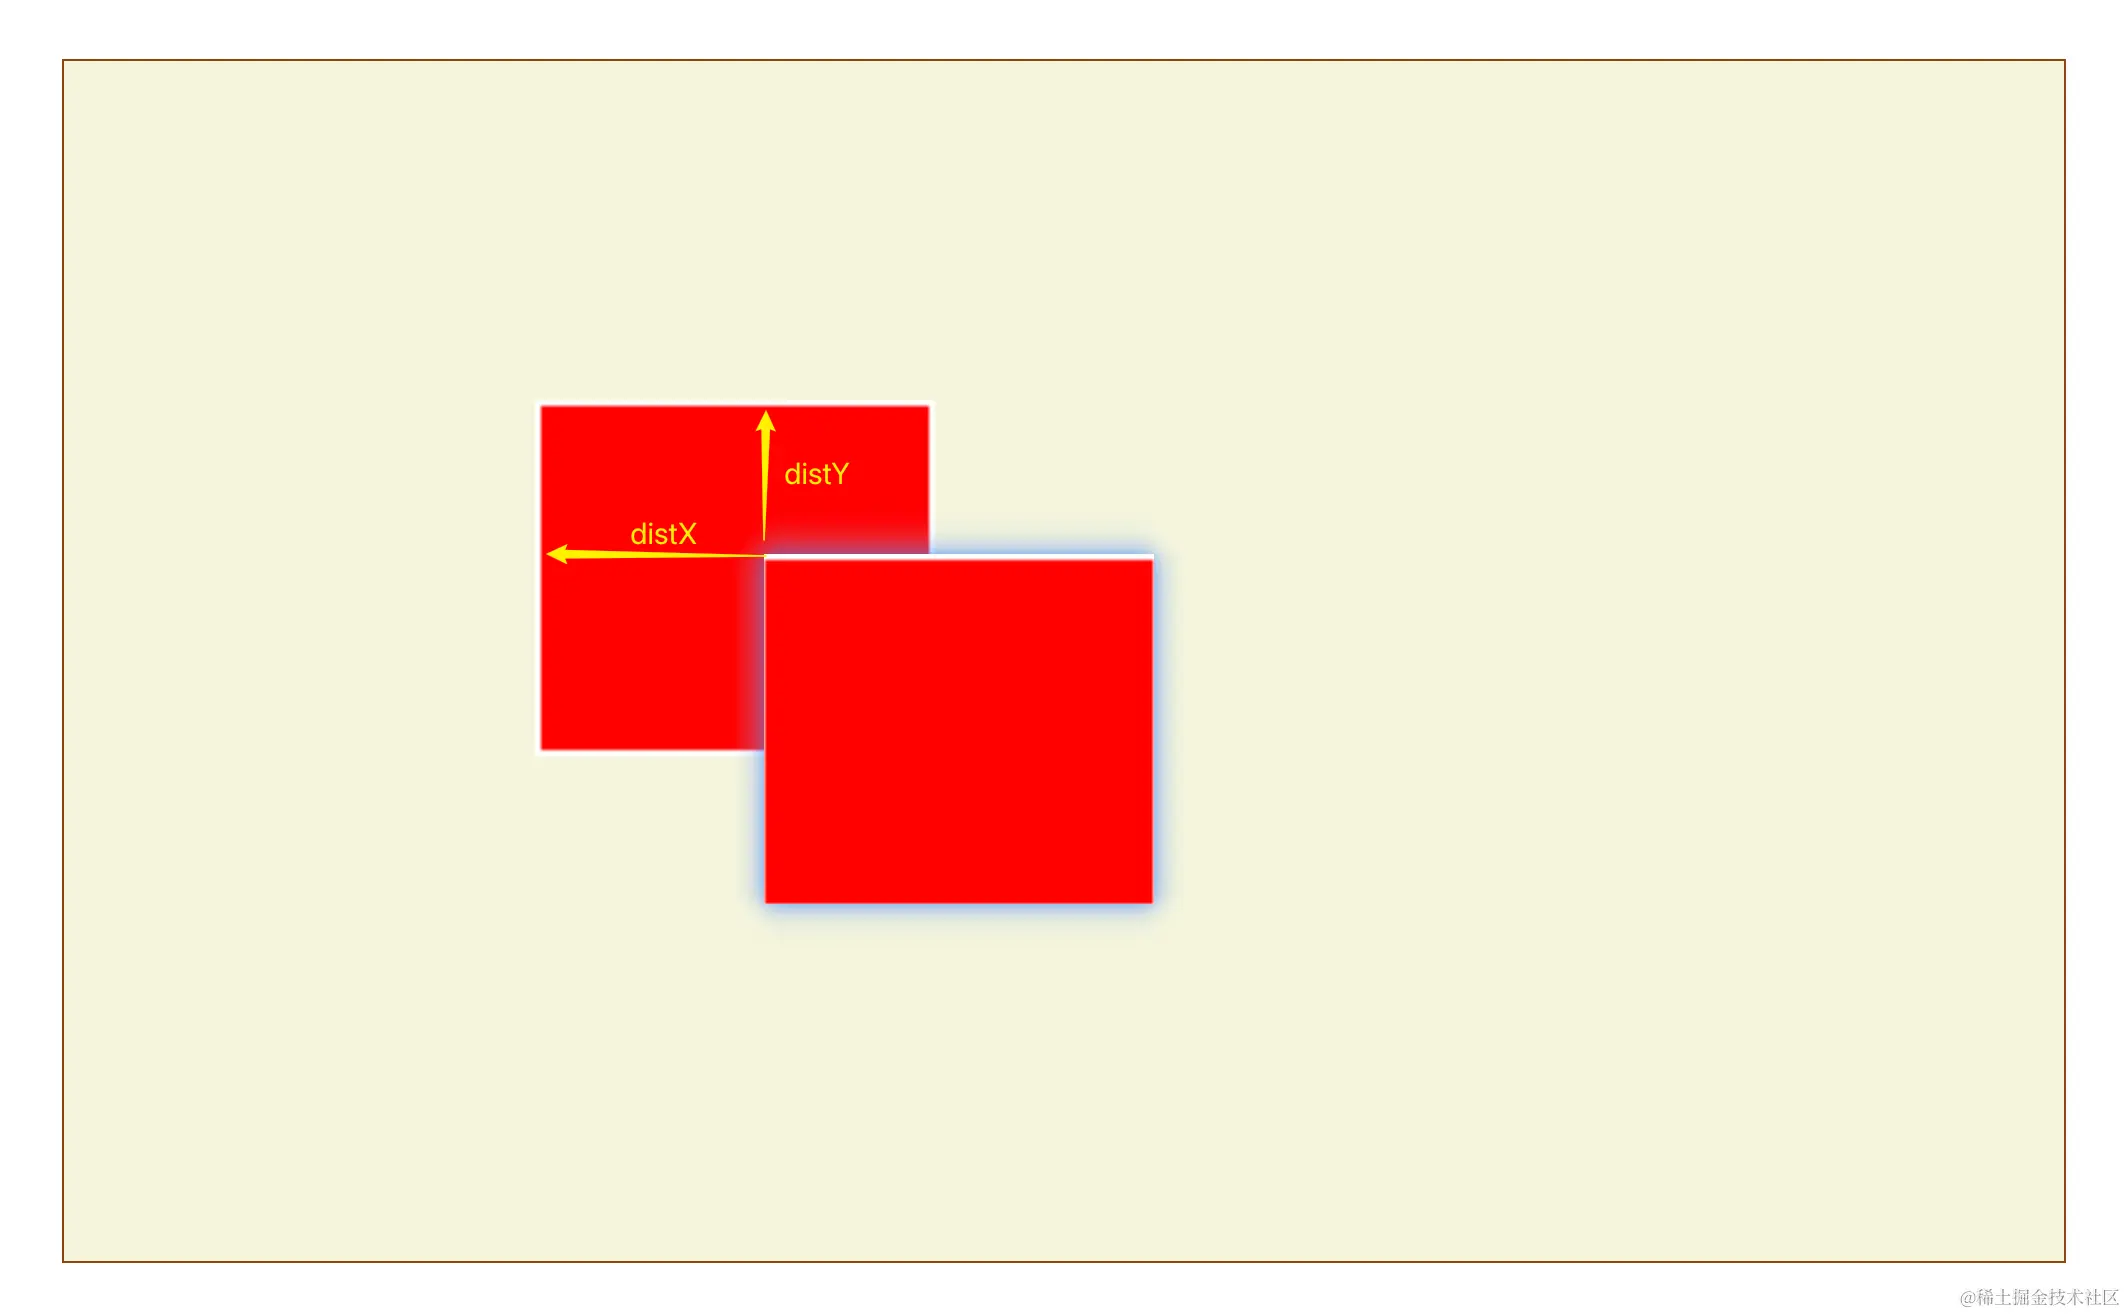
此时需同步更新该矩形的四个坐标值,并判断移动是否超出边界。
完整代码如下所示:
class Chart{
	...
	bindEvent() {
		const that = this
    this.cvs.onmousedown = function (e) {
			this.isClickDown = true
      const [clickX, clickY] = [e.offsetX, e.offsetY]
      const shape = that.getShapes(clickX, clickY)
			if (shape) {
        // 如果找到图形,说明是拖拽
        shape.action = 'MOVE'
        const { startX, startY, endX, endY } = shape
        that.cvs.onmousemove = function (e) {
          const disX = e.offsetX - clickX
          const disY = e.offsetY - clickY

          const newStartX = startX + disX
          const newEndX = endX + disX
          const newStartY = startY + disY
          const newEndY = endY + disY
          // 判断是否超出边界(矩形)
          if (newStartX < 0 || newEndX > that.cvs.width || newStartY < 0 || newEndY > that.cvs.height) {
            return
          }
          shape.startX = newStartX
          shape.endX = newEndX
          shape.startY = newStartY
          shape.endY = newEndY
        }
      } else {
        // 没找到,则是新建图形
        const shape = new Rectangle(that.ctx, '#f00', clickX, clickY)
        that.shapes.push(shape)
        that.cvs.onmousemove = function (e) {
          shape.endX = e.offsetX
          shape.endY = e.offsetY
        }
		}
	}

	getShapes(x, y) {
    for (let i = this.shapes.length - 1; i >= 0; i--) {
      const s = this.shapes[i]
      if (s.isInside(x, y)) {
        return s
      }
    }
    return null
  }
}
鼠标按下后初始化onmousemove和onmouseup等事件。onmousemove、onmouseup和onmouseout事件处理相对简单,主要涉及取消鼠标移动和抬起事件的绑定。
    that.cvs.onmouseup = function () {
      this.isClickDown = false
      that.cvs.onmousemove = null
      that.cvs.onmouseup = null
    }
    that.cvs.onmouseout = function () {
      this.isClickDown = false
      that.cvs.onmousemove = null
      that.cvs.onmouseup = null
    }
最终代码整合。
至此,矩形的简单绘制与拖拽功能已完成,后续缩放功能可单独撰文讲解。按照此模式,其他几何图形只需新建对应类即可,扩展性良好。
完整代码示例。
// drawClass.js
/**
 * 生成唯一ID
 * @param {Number} length  生成id的长度
 * @returns
 */
const genID = (length = 3) => {
  return Number(Math.random().toString().substr(3, length) + Date.now()).toString(36)
}

class Chart {
  constructor(canvasId) {
    this.cvs = document.getElementById(canvasId)
    this.ctx = this.cvs.getContext('2d')
    this.shapes = [] // 保存图形数据的数组
    this.init() // 初始化canvas得宽高
    this.bindEvent() // 为canvas绑定鼠标事件
    this.draw() // canvas的绘制
    this.isClickDown = false // 当前鼠标是否按下
    this.isPolygon = false
    this.currentShape = null // 当前选中的图形
  }

  init() {
    const w = 1000,
      h = 600
    this.cvs.width = w
    this.cvs.height = h
  }

  bindEvent() {
    const that = this
    this.cvs.onmousedown = function (e) {
      this.isClickDown = true
      const [clickX, clickY] = [e.offsetX, e.offsetY]
      const shape = that.getShapes(clickX, clickY)
      if (shape) {
        // 如果找到图形,说明是拖拽
        shape.action = 'MOVE'
        const { startX, startY, endX, endY } = shape
        that.cvs.onmousemove = function (e) {
          const disX = e.offsetX - clickX
          const disY = e.offsetY - clickY

          const newStartX = startX + disX
          const newEndX = endX + disX
          const newStartY = startY + disY
          const newEndY = endY + disY
          // 判断是否超出边界(矩形)
          if (newStartX < 0 || newEndX > that.cvs.width || newStartY < 0 || newEndY > that.cvs.height) {
            return
          }
          shape.startX = newStartX
          shape.endX = newEndX
          shape.startY = newStartY
          shape.endY = newEndY
        }
      } else {
        // 没找到,则是新建图形
        const shape = new Rectangle(that.ctx, '#f00', clickX, clickY)
        that.shapes.push(shape)
        that.cvs.onmousemove = function (e) {
          shape.endX = e.offsetX
          shape.endY = e.offsetY
          const radius = Math.sqrt(
            Math.pow(e.offsetX - clickX, 2) + Math.pow(e.offsetY - clickY, 2)
          )
          shape.radius = radius
        }
      }
      that.cvs.onmouseup = function () {
        this.isClickDown = false
        that.cvs.onmousemove = null
        that.cvs.onmouseup = null
      }
      that.cvs.onmouseout = function () {
        this.isClickDown = false
        that.cvs.onmousemove = null
        that.cvs.onmouseup = null
      }
    }
  }

  getShapes(x, y) {
    for (let i = this.shapes.length - 1; i >= 0; i--) {
      const s = this.shapes[i]
      if (s.isInside(x, y)) {
        return s
      }
    }
    return null
  }

  draw() {
    requestAnimationFrame(this.draw.bind(this))
    this.ctx.clearRect(0, 0, this.cvs.width, this.cvs.height) // 首先清空canvas
    // 将shapes里面的图形重新绘制
    for (const s of this.shapes) {
      s.draw()
    }
  }
}

class Rectangle {
  constructor(el,color, startX, startY) {
    this.el = el // 保存需要绘制的载体
    this.shapeType = 'RECT' // 当前几何图形的类别
    this.color = color // 填充的颜色
    // 初始化起点,默认起点和终点一样
    this.startX = startX
    this.startY = startY
    this.endX = startX
    this.endY = startY
    this.action = 'CREATE'  // 当前的操作类型
    this.id = genID() // 当前实例的唯一id
  }

  get minX() {
    return Math.min(this.startX, this.endX)
  }

  get maxX() {
    return Math.max(this.startX, this.endX)
  }

  get minY() {
    return Math.min(this.startY, this.endY)
  }

  get maxY() {
    return Math.max(this.startY, this.endY)
  }

  draw() {
    this.el.beginPath()  // 画笔起始点
    this.el.rect(
      this.minX,
      this.minY,
      (this.maxX - this.minX),
      (this.maxY - this.minY)
    )
    this.el.fillStyle = this.color // 填充颜色
    this.el.fill()
    this.el.strokeStyle = '#fff' // 边框的颜色
    this.el.lineCap = 'square'
    this.el.lineWidth = 3 // 边框粗细
    this.el.stroke() //画笔的终点
  }

  isInside(x, y) {
    return x >= this.minX && x <= this.maxX && y >= this.minY && y <= this.maxY
  }
}
本文介绍了利用原生JS Canvas实现图形标注功能的方法,更多相关JS Canvas图形标注内容可搜索本站往期文章或继续浏览后续文章,感谢支持。
D3.js 处理大规模数据点的性能优化策略
2026-11-05 15:37:25
JS实现网页摄像头实时扫码:结合getUserMedia与jsQR教程
2026-11-05 15:27:28
D3.js v5 迁移到 v7 的 API 变更与注意事项
2026-11-05 11:57:17
使用 animate.js 实现多元素协同的序列动画
2026-11-04 22:27:53
JS拖拽排序时怎么添加平滑动画效果?FLIP技术实战
2026-11-04 10:12:22