

ECharts柱状图顶部显示数值标签配置方法
作者:小满时间:2026-10-31 10:35:21浏览:505
本文介绍如何在ECharts柱状图中实现数据标签在柱子顶部的显示效果。通过配置series中的label属性,设置show为true并调整position为top,即可在图表上方清晰展示具体数值。包含完整配置代码示例,适用于需要直观展示数据大小的场景。
ECharts柱状图顶部标签配置
如何在柱状图顶部显示数据标签?具体效果可参考下图展示。
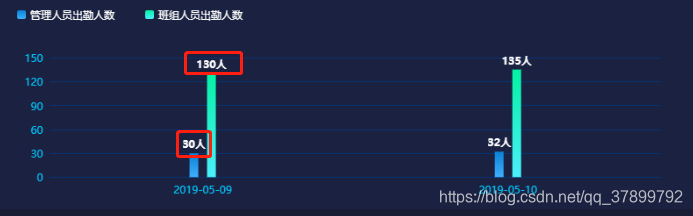
实现该效果的关键配置代码如下。
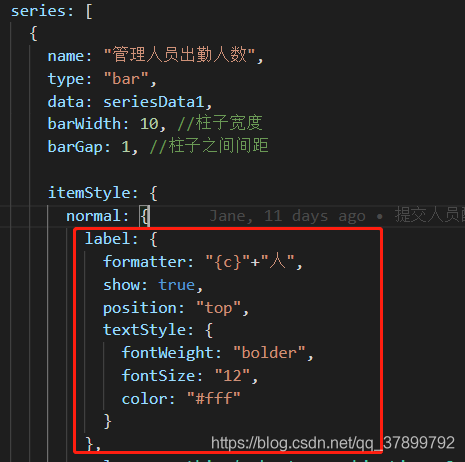
完整的ECharts配置代码如下所示。
let myChart = this.$echarts.init(document.getElementById("goodsChart"));
      // 绘制图表
      myChart.setOption({
        tooltip: {
          trigger: "axis",
          axisPointer: {
            type: "shadow"
          }
        },
        legend: {
          data: ["管理人员出勤人数", "班组人员出勤人数"],
          align: "left",
          left: 10,
          textStyle: {
            color: "#fff"
          },
          itemWidth: 10,
          itemHeight: 10,
          itemGap: 35
        },
        grid: {
          left: "3%",
          right: "4%",
          bottom: "3%",
          containLabel: true
        },
        xAxis: [
          {
            type: "category",
            data: xAxisData,
            axisLine: {
              show: true,
              lineStyle: {
                color: "#063374",
                width: 1,
                type: "solid"
              }
            },
            axisTick: {
              show: false
            },
            axisLabel: {
              show: true,
              textStyle: {
                color: "#00c7ff"
              }
            }
          }
        ],
        yAxis: [
          {
            type: "value",
            axisLabel: {
              formatter: "{value}"
            },
            axisTick: {
              show: false
            },
            axisLine: {
              show: false,
              lineStyle: {
                color: "#00c7ff",
                width: 1,
                type: "solid"
              }
            },
            splitLine: {
              lineStyle: {
                color: "#063374"
              }
            }
          }
        ],
        series: [
          {
            name: "管理人员出勤人数",
            type: "bar",
            data: seriesData1,
            barWidth: 10, //柱子宽度
            barGap: 1, //柱子之间间距

            itemStyle: {
              normal: {
                label: {
                  formatter: "{c}"+"人",
                  show: true,
                  position: "top",
                  textStyle: {
                    fontWeight: "bolder",
                    fontSize: "12",
                    color: "#fff"
                  }
                },
                color: new this.$echarts.graphic.LinearGradient(0, 0, 0, 1, [
                  {
                    offset: 1,
                    color: "#3db0fe"
                  },
                  {
                    offset: 0,
                    color: "#0a81d4"
                  }
                ]),
                opacity: 1
              }
            }
          },
          {
            name: "班组人员出勤人数",
            type: "bar",
            data: seriesData2,
            barWidth: 10,
            barGap: 1,
            itemStyle: {
              normal: {
                label: {
                  formatter: "{c}"+"人",
                  show: true,
                  position: "top",
                  textStyle: {
                    fontWeight: "bolder",
                    fontSize: "12",
                    color: "#fff"
                  }
                },
                color: new this.$echarts.graphic.LinearGradient(0, 0, 0, 1, [
                  {
                    offset: 1,
                    color: "#4af0fc"
                  },
                  {
                    offset: 0,
                    color: "#03f2a3"
                  }
                ]),
                opacity: 1
              }
            }
          }
        ]
      });
以上即为在ECharts柱状图顶部添加文字标签的完整实现方案,更多相关技术内容可查阅本站其他文章。
作者最新文章
JS空字符串、null和undefined转数字的结果是什么
2026-11-05 14:49:16
CodePen、JSFiddle与StackBlitz:主流JS在线编辑器对比
2026-11-05 13:38:29
JS怎么将时间戳转换为“刚刚”、“几分钟前”等相对时间
2026-11-05 12:55:14
JavaScript将儒略日逆向还原为公历日期时间的实现方法
2026-11-04 23:51:05
能在我的世界手机版直接修改JS代码吗
2026-11-04 19:02:53