

ECharts实现横向柱状图:数值内嵌与双轴布局技巧
作者:桌面漫游时间:2026-10-31 09:28:46浏览:358
本文介绍如何在ECharts中实现横向柱状图,重点解决数值标签显示在柱子内部、隐藏X轴标签及使用渐变色等需求。通过两种不同的Y轴配置方案,分别演示如何自由控制左右轴标签位置,以及标签跟随柱条右侧显示的简化写法,帮助开发者快速完成复杂图表定制。
近期项目中使用了多种ECharts图表组件,在此对实现过程进行整理记录。
主要涉及以下技术点:
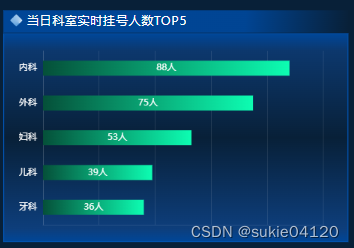
包括横向柱状图的绘制、隐藏X轴标签、为柱子添加渐变色,以及将数量与单位数值直接显示在柱条内部。
最终效果如下图所示:
ECharts配置代码如下:
此处将option配置对象放置在Vue组件的data中,随后通过动态获取Y轴数据及series系列数据,完成图表的最终渲染。
option: {
	tooltip: {
		trigger: 'axis',
		axisPointer: {
		type: 'shadow'
	    }
    },
	grid: {
		left: 0,
		top: '8%',
		right: '3%',
		bottom: '8%',
		containLabel: true
	},
	xAxis: {
		type: 'value',
		axisLabel: {
			show: false // 不显示x轴标签
		},
		axisLine: {
			// x轴线的颜色以及宽度
			show: true,
			lineStyle: {color: 'rgba(255,255,255,0.1)'}
			},
		axisTick: {
			show: false // x轴刻度线
		},
		splitLine: { // x轴网格线
			show: true,
				lineStyle: {color: 'rgba(255,255,255,0.1)'}
			}
		},
		yAxis: {
			type: 'category',
			axisTick: { show: false }, // y轴刻度线
			axisLabel: { color: '#fff' }, // y轴文字的配置
			axisLine: {
				//x轴线的颜色
				show: true,
				lineStyle: {color: 'rgba(255,255,255,0.1)'}
			},
			data: ['内科','外科','妇科','儿科','牙科']
		},
		series: [
			{
			name: '人数',
			type: 'bar',
			stack: '总量',
			label: {
				normal: {
					show: true,
					position: 'inside', //显示在柱子内部
					textStyle: { color: '#fff' },
					formatter: '{c}人' //单位
				}
			},
			itemStyle: {
				color: {
				    colorStops:[ //柱子的渐变色
        		    {
			            offset: 0,
			            color: 'rgba(5, 80, 57, 1)' // 0% 处的颜色
		            },
		            {
			            offset: 1,
			            color: 'rgba(13, 253, 178, 1)' // 100% 处的颜色
		            }
	                ],
				global: false
				}
			},
			barWidth: 20, //柱子的宽度
			data: [88,75,53,39,36]
		  }
	]
}
图表渲染方法及对应的HTML结构如下:
//html:
    <div class="echartDiv" ref="chart"></div>

//方法(渲染图表):
    initEcharts() {
			this.myChart && this.myChart.dispose();
			let chartDom = this.$refs.chart;
			this.myChart = echarts.init(chartDom);
			this.myChart.setOption(this.option);
			let that = this;
			window.addEventListener('resize', function() {
				that.myChart.resize();
			});
		},
补充说明:ECharts横向柱状图的两种常见实现方式。
示例效果如图所示:
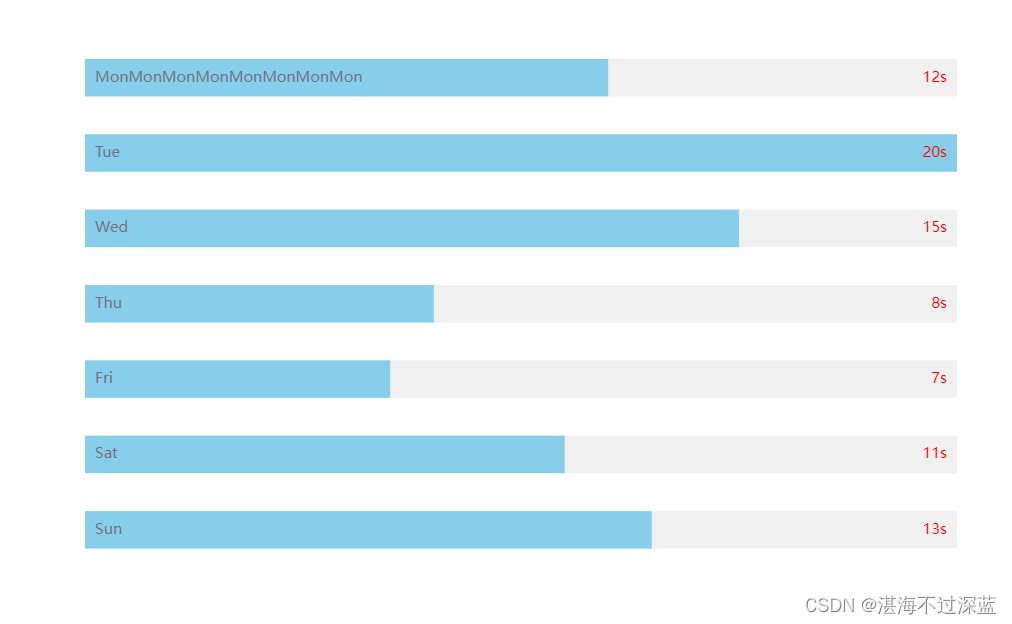
第一种方法支持灵活控制Y轴左侧和右侧标签的显示位置。
let option = {
    // 柱状图的位置
    grid: {
      left: '0%',
      right: '0%',
      bottom: '0%',
      top: '0',
      containLabel: false // 图表两侧是否留白
    },
    dataZoom: [
      {
        type: 'inside'
      }
    ],
    xAxis: {
      show: false,
      type: 'value'
    },
    yAxis: [
      // 左轴
      {
        type: 'category',
        inverse: true,
        axisLabel: {
          inside: true,
          zlevel: 2,
          color: '#fff'
        },
        axisTick: {
          show: false
        },
        axisLine: {
          show: false
        },
        data: props.dataX
      },
      // 右轴
      {
        type: 'category',
        inverse: true,
        axisTick: {
          show: false
        },
        axisLine: {
          show: false
        },
        axisLabel: {
          inside: true,
          formatter: '{value}s',
          color: 'black'
        },
        data: props.dataY,
      },
    ],
    series: [
      {
        zlevel: -1, // 层级
        type: 'bar',
        barWidth: 30, // 内柱条的宽度
        // animationDuration: 1500, // 内柱条的动画显示时间
        showBackground: true,
        // 内柱条样式
        itemStyle: {
          color: '#2596FF',
        },
        // ------------------数据及其样式----------------------------
        // 内柱条的数据
        data: props.dataY,
        align: 'center'
      },
    ],
  }
第二种方法中,Y轴右侧标签的位置无法自由调整,文字仅能显示在内部柱条的右侧。
let option = {
    // 柱状图的位置
    grid: {
      left: '0%',
      right: '0%',
      bottom: '0%',
      top: '0',
      containLabel: false // 图表两侧是否留白
    },
    dataZoom: [
      {
        type: 'inside'
      }
    ],
    xAxis: {
      show: false,
      type: 'value'
    },
    yAxis: {
      type: "category",
      triggerEvent: true,
      data: props.dataX,
      axisLine: { show: false },  //不显示坐标轴
      axisTick: { show: false },  //不显示坐标轴刻度线
      axisLabel: {
        inside: true, // 坐标显示在轴内侧
        zlevel: 1,
        color: '#ccc',
      },
      splitLine: {
      	show: false,
      },
    },
    dataZoom: [
      {
        type: 'inside'
      }
    ],
    series: [
      {
       	name: '',
        zlevel: -1,
        type: "bar",
        color: '#2596FF',
        barWidth: 30,
        showBackground: true,
        backgroundStyle: {
           color: 'rgba(180, 180, 180, 0.2)'
        },
        label: {
          show: true,
          position: "right",
          color: "red",
          fontSize: "12px",
          formatter: '{c}s',
        },
        data: props.dataY,
      },
    ],
  }
总结
以上就是关于ECharts横向柱状图简单实现的详细介绍,更多相关内容可查阅本站往期文章或继续浏览后续教程,感谢支持。
作者最新文章
Mock.js 拦截失效或数据格式错误的常见原因及排查
2026-11-05 10:11:59
Java和JavaScript名字像但没关系:辨析Java、JavaWeb与JS
2026-11-04 09:30:54
CodePen、JSFiddle与RunJS对比:哪款JS在线运行工具更适合你?
2026-11-03 16:46:57
JS 统计图渲染空白或报错怎么排查?常见问题解决指南
2026-11-03 09:49:40
flv.js 常见报错 MediaError 与解码失败排查指南
2026-11-02 10:29:29