

JavaScript Canvas绘制两点间曲线、矩形及箭头实现
作者:流萤时间:2026-10-31 07:20:05浏览:432
本文详解如何使用JavaScript在Canvas中绘制两点间的贝塞尔曲线,并在终点绘制矩形与居中文字。核心内容包含箭头方向的计算与绘制逻辑,提供完整的HTML、CSS及JS代码示例,实现从起点到终点的可视化连接效果。
使用JavaScript结合Canvas API,可以在画布上绘制连接两点的曲线,并在曲线终点处绘制矩形框及居中对齐的文字。同时,实现了在连接线上添加箭头的功能,具体视觉效果如图所示:
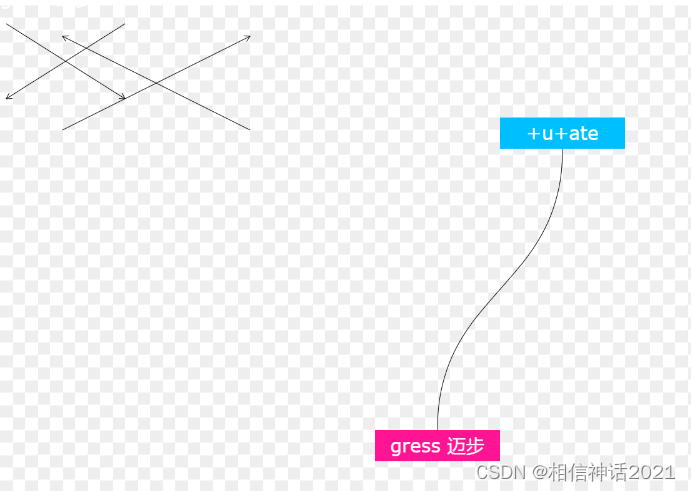
一、HTML结构代码
具体实现代码如下:
<canvas id="canvas" width="1000" height="600"></canvas>
二、CSS样式代码
canvas {
			    display: block;
			    width: 1000px;
			    height: 600px;
			    background: conic-gradient(#eee 25%, white 0deg 50%, #eee 0deg 75%, white 0deg) 0 / 20px 20px;
			    margin-inline: auto;
			}
			@media (max-width: 640px) {
			    canvas {
			        width: 100vw;
			        height: 60vw;
			    }
			}
三、JavaScript逻辑代码
具体实现代码如下:
var context = document.getElementById("canvas").getContext("2d"); ;
			// 绘制尺寸
			var width = canvas.width;
			var height = canvas.height;

			// 两个方块的坐标、尺寸,颜色等数据
			var data = [{
			    x: 800,
			    y: 180,
			    width: 200,
			    height: 50,
			    color: 'deepskyblue',
				text:"+u+ate"
			}, {
			    x: 600,
			    y: 680,
			    width: 200,
			    height: 50,
			    color: 'deeppink',
				text:"gress 迈步"
			}];
			// 绘制矩形方法
			var drawRect = function () {
			    data.forEach(function (obj) {
			        context.beginPath();
			        context.fillStyle = obj.color;
			        context.fillRect(obj.x, obj.y, obj.width, obj.height);
			        context.closePath();
					context.font="30px Verdana";
					context.fillStyle="#fff";
					console.log(context.measureText(obj.text))
					const textMetrics = context.measureText(obj.text);
					// 所有字在这个字体下的高度
					let fontHeight = textMetrics.fontBoundingBoxAscent + textMetrics.fontBoundingBoxDescent;
					console.log(fontHeight)

					context.fillText(obj.text,0,0)
					context.fillText(obj.text,obj.x+(obj.width-context.measureText(obj.text).width)/2,obj.y+fontHeight);
			    });

			};

			// 绘制连接曲线方法
			var drawCurve = function () {
			    // 按照坐标位置排序
			    var dataSort = data.sort(function (objA, objB) {
			        return (objA.y + objA.height) - (objB.y + objB.height);
			    });
			    // 知道上下数据
			    var from = dataSort[0];
			    var to = dataSort[1];

			    // 曲线的起点终点
			    var fromX = from.x + from.width / 2;
			    var fromY = from.y + from.height;
			    var toX = to.x + to.width / 2;
			    var toY = to.y;

			    // 曲线控制点坐标
			    var cp1x = fromX;
			    var cp1y = fromY + (toY - fromY) / 2;

			    var cp2x = toX;
			    var cp2y = toY - (toY - fromY) / 2;

			    // 开始绘制曲线
			    context.beginPath();
			    context.lineWidth = 1
			    context.strokeStyle = '#000';
			    context.moveTo(fromX, fromY);
			    // 绘制曲线点
			    context.bezierCurveTo(cp1x, cp1y, cp2x, cp2y, toX, toY);
			    context.stroke();
			};

			// 绘制方法
			var draw = function () {
			    context.clearRect(0, 0, width, height);
			     drawRect();
			     drawCurve();
			};

			draw();

			canvas_arrow(ctx, 10, 30, 200, 150);
			canvas_arrow(ctx, 100, 200, 400, 50);
			canvas_arrow(ctx, 200, 30, 10, 150);
			canvas_arrow(ctx, 400, 200, 100, 50);
			ctx.stroke();

			function canvas_arrow(context, fromx, fromy, tox, toy) {
			  var headlen = 10; // length of head in pixels
			  var dx = tox - fromx;
			  var dy = toy - fromy;
			  var angle = Math.atan2(dy, dx);
			  context.moveTo(fromx, fromy);
			  context.lineTo(tox, toy);
			  context.lineTo(tox - headlen * Math.cos(angle - Math.PI / 6), toy - headlen * Math.sin(angle - Math.PI / 6));
			  context.moveTo(tox, toy);
			  context.lineTo(tox - headlen * Math.cos(angle + Math.PI / 6), toy - headlen * Math.sin(angle + Math.PI / 6));
			}
至此,核心代码部分已展示完毕。
完整可运行代码
<!DOCTYPE HTML>
<html>
	<head>
		<style>
			canvas {
			    display: block;
			    width: 1000px;
			    height: 600px;
			    background: conic-gradient(#eee 25%, white 0deg 50%, #eee 0deg 75%, white 0deg) 0 / 20px 20px;
			    margin-inline: auto;
			}
			@media (max-width: 640px) {
			    canvas {
			        width: 100vw;
			        height: 60vw;
			    }
			}
		</style>
	</head>
	<body>
		<canvas id="canvas" width="2000" height="1200"></canvas>
		<script>
			var context = document.getElementById("canvas").getContext("2d"); ;
			// 绘制尺寸
			var width = canvas.width;
			var height = canvas.height;

			// 两个方块的坐标、尺寸,颜色等数据
			var data = [{
			    x: 800,
			    y: 180,
			    width: 200,
			    height: 50,
			    color: 'deepskyblue',
				text:"+u+ate"
			}, {
			    x: 600,
			    y: 680,
			    width: 200,
			    height: 50,
			    color: 'deeppink',
				text:"gress 迈步"
			}];
			// 绘制矩形方法
			var drawRect = function () {
			    data.forEach(function (obj) {
			        context.beginPath();
			        context.fillStyle = obj.color;
			        context.fillRect(obj.x, obj.y, obj.width, obj.height);
			        context.closePath();
					context.font="30px Verdana";
					context.fillStyle="#fff";
					console.log(context.measureText(obj.text))
					const textMetrics = context.measureText(obj.text);
					// 所有字在这个字体下的高度
					let fontHeight = textMetrics.fontBoundingBoxAscent + textMetrics.fontBoundingBoxDescent;
					console.log(fontHeight)

					context.fillText(obj.text,0,0)
					context.fillText(obj.text,obj.x+(obj.width-context.measureText(obj.text).width)/2,obj.y+fontHeight);
			    });

			};

			// 绘制连接曲线方法
			var drawCurve = function () {
			    // 按照坐标位置排序
			    var dataSort = data.sort(function (objA, objB) {
			        return (objA.y + objA.height) - (objB.y + objB.height);
			    });
			    // 知道上下数据
			    var from = dataSort[0];
			    var to = dataSort[1];

			    // 曲线的起点终点
			    var fromX = from.x + from.width / 2;
			    var fromY = from.y + from.height;
			    var toX = to.x + to.width / 2;
			    var toY = to.y;

			    // 曲线控制点坐标
			    var cp1x = fromX;
			    var cp1y = fromY + (toY - fromY) / 2;

			    var cp2x = toX;
			    var cp2y = toY - (toY - fromY) / 2;

			    // 开始绘制曲线
			    context.beginPath();
			    context.lineWidth = 1
			    context.strokeStyle = '#000';
			    context.moveTo(fromX, fromY);
			    // 绘制曲线点
			    context.bezierCurveTo(cp1x, cp1y, cp2x, cp2y, toX, toY);
			    context.stroke();
			};

			// 绘制方法
			var draw = function () {
			    context.clearRect(0, 0, width, height);
			     drawRect();
			     drawCurve();
			};

			draw();

			canvas_arrow(ctx, 10, 30, 200, 150);
			canvas_arrow(ctx, 100, 200, 400, 50);
			canvas_arrow(ctx, 200, 30, 10, 150);
			canvas_arrow(ctx, 400, 200, 100, 50);
			ctx.stroke();

			function canvas_arrow(context, fromx, fromy, tox, toy) {
			  var headlen = 10; // length of head in pixels
			  var dx = tox - fromx;
			  var dy = toy - fromy;
			  var angle = Math.atan2(dy, dx);
			  context.moveTo(fromx, fromy);
			  context.lineTo(tox, toy);
			  context.lineTo(tox - headlen * Math.cos(angle - Math.PI / 6), toy - headlen * Math.sin(angle - Math.PI / 6));
			  context.moveTo(tox, toy);
			  context.lineTo(tox - headlen * Math.cos(angle + Math.PI / 6), toy - headlen * Math.sin(angle + Math.PI / 6));
			}
		</script>
	</body>
</html>
关于使用JavaScript在Canvas中绘制两点间曲线和箭头的教程到此结束。如需了解更多JavaScript与Canvas相关内容,建议搜索本站历史文章或继续阅读后续相关教程,感谢大家的支持!
作者最新文章
JavaScript将图片转换为Base64编码的两种途径
2026-11-05 16:43:05
怎么在 Vue 或 React 项目中正确集成 animate.js
2026-11-05 10:23:38
JS注册事件:addEventListener基础语法与参数详解
2026-11-05 08:44:56
JSP和JS的区别:运行环境与服务端/客户端职责解析
2026-11-04 23:34:36
pdf.js 官方下载地址:GitHub Release 获取预编译包
2026-11-04 23:07:27