

ECharts饼图颜色设置的4种方式总结
作者:开源拾贝时间:2026-10-31 06:00:29浏览:649
本文总结了ECharts饼状图颜色设置的4种方法。包括在series、option和data中分别配置颜色,以及实现随机颜色的技巧。通过具体代码示例,展示如何自定义或动态生成饼图各扇区的显示颜色,帮助开发者灵活控制图表视觉效果。
ECharts 实现饼图色彩配置的教程
- 方案一:于
series中设定饼图色彩 - 方案二:于
option中设定饼图色彩 - 方案三:于
data中设定饼图色彩 - 方案四:设定 ECharts 饼图随机色彩
Charts 饼图中各扇区色彩均可自定义或随机生成。本文阐述 4 种修改 ECharts 饼图色彩的配置方法。
方案一:于 series 中设定饼图色彩
series: [
  itemStyle: {
    normal: {
      color: function (colors) {
         var colorList = [
                    '#fc8251',
                    '#5470c6',
                    '#9A60B4',
                    '#ef6567',
                    '#f9c956',
                    '#3BA272'
                  ];
         return colorList[colors.dataIndex];
       }
     },
   }
 ]
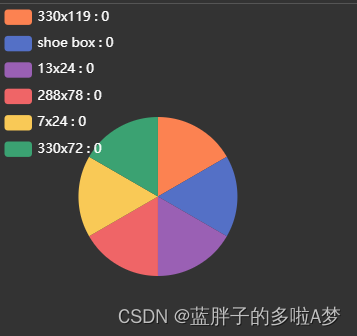
EChart.js 在 series 中配置饼图色彩的 Demo 源码:
 this.chart.setOption({
        legend: {
          orient: "vertical",
          left: "left",
          textStyle: {
            //图例中文字的样式
            color: "#ffffff",
            fontSize: 12,
          },
        },
        series: [
          {
            type: "pie",
            radius: "50%",
            data: this.optionData,
            emphasis: {
              itemStyle: {
                shadowBlur: 10,
                shadowOffsetX: 0,
                shadowColor: "rgba(0, 0, 0, 0.5)",
              },
            },
            labelLine: {
              show: false, //隐藏指示线
            },
            label: {
              show: false, //隐藏标示文字
            },
            itemStyle: {
              normal: {
                color: function (colors) {
                  var colorList = [
                    '#fc8251',
                    '#5470c6',
                    '#9A60B4',
                    '#ef6567',
                    '#f9c956',
                    '#3BA272'
                  ];
                  return colorList[colors.dataIndex];
                }
              },
            }
          },
        ],
      });
效果展示
方案二:于 option 中设定饼图色彩
 this.chart.setOption({
        legend: {
          orient: "vertical",
          left: "left",
          textStyle: {
            //图例中文字的样式
            color: "#ffffff",
            fontSize: 12,
          },
        },
        color:['#fc8251','#5470c6','#9A60B4','#ef6567', '#f9c956','#3BA272'];
        series: [
          {
            type: "pie",
            radius: "50%",
            data: this.optionData,
            emphasis: {
              itemStyle: {
                shadowBlur: 10,
                shadowOffsetX: 0,
                shadowColor: "rgba(0, 0, 0, 0.5)",
              },
            },
            labelLine: {
              show: false, //隐藏指示线
            },
            label: {
              show: false, //隐藏标示文字
            },
          },
        ],
      });
方案三:于 data 中设定饼图色彩
**data: [
        { value: 917, name: '搜索引擎',itemStyle: {color:'#fc8251'}},
        { value: 873, name: '微信朋友圈',itemStyle: {color:'#5470c6'}},
        { value: 678, name: 'Feeds 广告',itemStyle: {color:'#91cd77'}},
        { value: 583, name: '直接访问',itemStyle: {color:'#ef6567'}},
        { value: 432, name: '口碑介绍',itemStyle: {color:'#f9c956'}}
      ]
**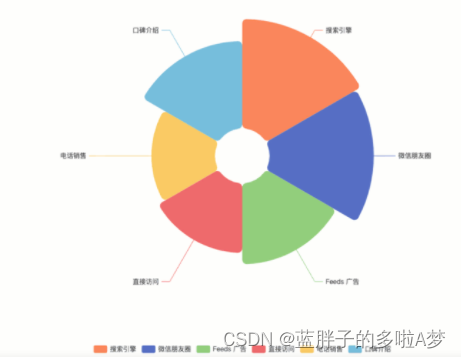
EChart.js 在 data 中配置饼图色彩的 Demo 源码:
option = {
  legend: {
    top: 'bottom'
  },
  series: [
    {
      name: '',
      type: 'pie',
      radius: [50, 250],
      center: ['50%', '50%'],
      roseType: 'area',
      itemStyle: {
        borderRadius: 8
      },
      data: [
        { value: 917, name: '搜索引擎',itemStyle: {color:'#fc8251'}},
        { value: 873, name: '微信朋友圈',itemStyle: {color:'#5470c6'}},
        { value: 678, name: 'Feeds 广告',itemStyle: {color:'#91cd77'}},
        { value: 583, name: '直接访问',itemStyle: {color:'#ef6567'}},
        { value: 332, name: '电话销售',itemStyle: {color:'#f9c956'} },
        { value: 432, name: '口碑介绍',itemStyle: {color:'#75bedc'}}
      ]
    }
  ]
};
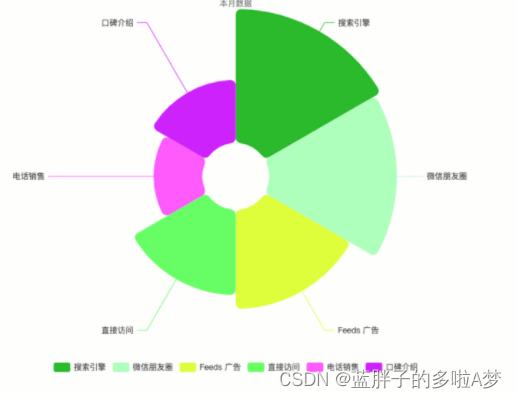
方案四:设定 ECharts 饼图随机色彩
color: function () {
          return (
            'rgb(' +
            [
              Math.round(Math.random() * 270),
              Math.round(Math.random() * 370),
              Math.round(Math.random() * 400)
            ].join(',') +
            ')'
          );
        },
option = {
  legend: {
    top: 'bottom'
  },
  series: [
    {
      name: '',
      type: 'pie',
      radius: [50, 250],
      center: ['50%', '50%'],
      roseType: 'area',
      itemStyle: {
        color: function () {
          return (
            'rgb(' +
            [
              Math.round(Math.random() * 270),
              Math.round(Math.random() * 370),
              Math.round(Math.random() * 400)
            ].join(',') +
            ')'
          );
        },
        borderRadius: 8
      },
      data: [
        { value: 917, name: '搜索引擎'},
        { value: 873, name: '微信朋友圈'},
        { value: 678, name: 'Feeds 广告'},
        { value: 583, name: '直接访问'},
        { value: 332, name: '电话销售'},
        { value: 432, name: '口碑介绍'}
      ]
    }
  ]
};
总结
至此,关于 ECharts 饼图色彩配置的 4 种方式总结完毕。如需了解更多 ECharts 色彩设置内容,请查阅本站往期文章或继续浏览后续内容,感谢支持!
作者最新文章
JS 怎么使用 pako.js 解压 gzip 数据流
2026-11-05 15:54:33
零基础先学JavaScript还是Python?对比学习难度与上手曲线
2026-11-05 14:47:40
JS代码反混淆:主流在线工具与本地软件推荐
2026-11-04 19:28:41
浏览器控制台查看格式化JSON有哪些实用技巧
2026-11-04 16:56:53
JS控制台打印基础:console.log语法与多参数用法
2026-11-04 09:23:11