

OpenLayers实现点要素图层聚合显示及特殊处理
本文介绍在OpenLayers中处理海量点要素图层的方法。通过图层聚合技术,可有效缓解地图加载时的视觉拥挤与界面卡顿问题。文章详细讲解了聚合的基本步骤,并针对最大缩放层级下仍保持聚合、单点取消聚合等特殊场景,提供了基于事件监听和样式回调的具体代码实现方案。
前言
当点要素图层中的数据量达到数百甚至数千时,若直接加载至地图,不仅会导致视觉体验不佳,还会引发地图界面卡顿。以下代码演示了生成并显示1000个随机点的过程:
<!DOCTYPE html>
<html>
<head>
    <meta http-equiv="Content-Type" content="text/html; charset=utf-8" />
    <meta charset="utf-8" />
    <title>OpenLayers</title>
    <style>
        html, body, #map {
            width: 100%;
            height: 100%;
            margin: 0;
            padding: 0;
        }
    </style>
    <link href="libs/ol/ol.css" rel="stylesheet" />
    <script src="libs/ol/ol.js"></script>
</head>
<body>
    <div id="map"></div>

    <script>
        // 随机创建1000个要素
        var source = new ol.source.Vector();
        for (var i = 1; i <= 200; i++) {
            var coordinates = [120.00 + Math.random(), 30.00 + Math.random()];
            var feature = new ol.Feature(new ol.geom.Point(coordinates));
            source.addFeature(feature);
        }
        for (var i = 1; i <= 200; i++) {
            var coordinates = [120.01 + Math.random(), 30.01 + Math.random()];
            var feature = new ol.Feature(new ol.geom.Point(coordinates));
            source.addFeature(feature);
        }
        for (var i = 1; i <= 200; i++) {
            var coordinates = [120.02 + Math.random(), 30.02 + Math.random()];
            var feature = new ol.Feature(new ol.geom.Point(coordinates));
            source.addFeature(feature);
        }
        for (var i = 1; i <= 200; i++) {
            var coordinates = [120.03 + Math.random(), 30.03 + Math.random()];
            var feature = new ol.Feature(new ol.geom.Point(coordinates));
            source.addFeature(feature);
        }
        for (var i = 1; i <= 200; i++) {
            var coordinates = [120.04 + Math.random(), 30.04 + Math.random()];
            var feature = new ol.Feature(new ol.geom.Point(coordinates));
            source.addFeature(feature);
        }

        // 创建图层
        var layer = new ol.layer.Vector({
            source: source,
            style: function (feature, resolution) {
                var style = new ol.style.Style({
                    image: new ol.style.Icon({
                        src: 'img/location.png'
                    })
                })
                return style;
            }
        });

        // 创建地图
        var map = new ol.Map({
            target: 'map',
            layers: [
                new ol.layer.Tile({
                    source: new ol.source.OSM()
                }),
                layer
            ],
            view: new ol.View({
                projection: 'EPSG:4326',
                center: [120, 30],
                zoom: 10,
                minZoom: 5,
                maxZoom: 14
            })
        });
    </script>
</body>
</html>
运行效果如图:
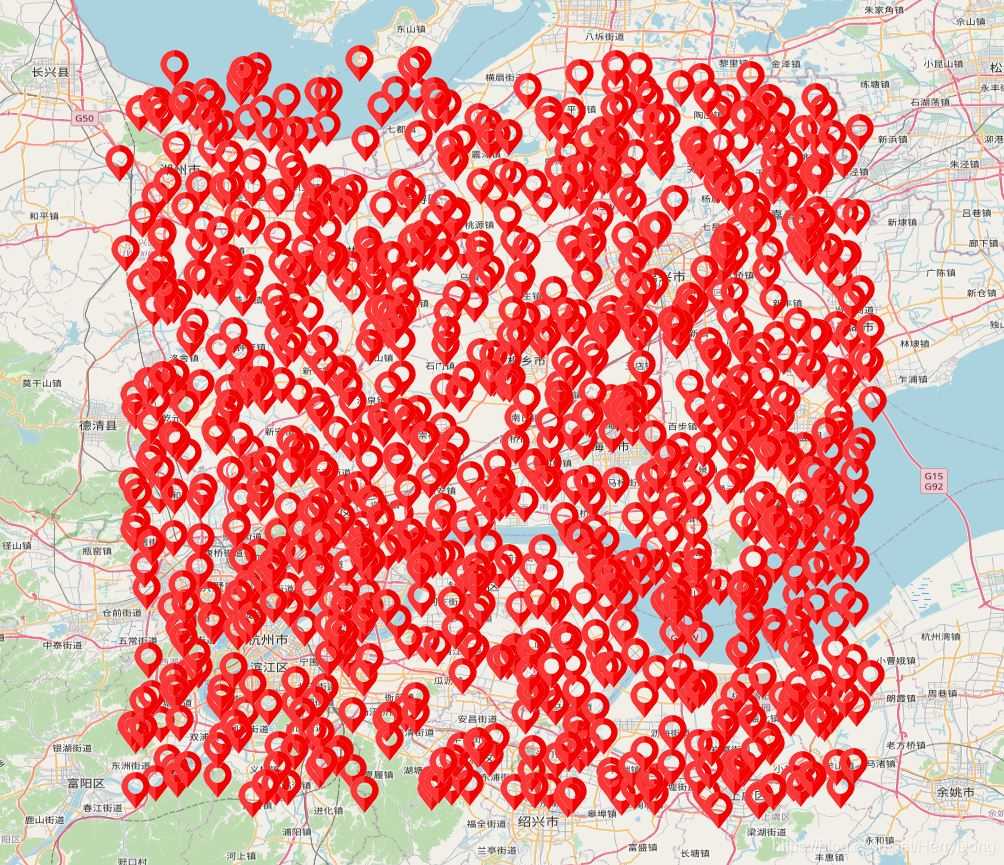
大量点位重叠会导致视觉混乱。通常,面对密集的点要素图层,我们会采用图层聚合进行优化。但需注意:图层聚合只对点要素图层有效,对线和面图层无效。
点要素图层聚合实现
在openlayers框架中,实现图层聚合的标准流程如下:
- 构建要素对象
- 创建数据源并将要素添加其中
- 初始化聚合数据源,并配置聚合距离参数
- 创建矢量图层,指定其数据源为聚合数据源
- 初始化地图实例,并将聚合图层添加至地图
聚合功能的核心代码如下:
<!DOCTYPE html>
<html>
<head>
    <meta http-equiv="Content-Type" content="text/html; charset=utf-8" />
    <meta charset="utf-8" />
    <title>OpenLayers</title>
    <style>
        html, body, #map {
            width: 100%;
            height: 100%;
            margin: 0;
            padding: 0;
        }
    </style>
    <link href="libs/ol/ol.css" rel="stylesheet" />
    <script src="libs/ol/ol.js"></script>
</head>
<body>
    <div id="map"></div>

    <script>
        // 随机创建1000个要素
        var source = new ol.source.Vector();
        for (var i = 1; i <= 200; i++) {
            var coordinates = [120.00 + Math.random(), 30.00 + Math.random()];
            var feature = new ol.Feature(new ol.geom.Point(coordinates));
            source.addFeature(feature);
        }
        for (var i = 1; i <= 200; i++) {
            var coordinates = [120.01 + Math.random(), 30.01 + Math.random()];
            var feature = new ol.Feature(new ol.geom.Point(coordinates));
            source.addFeature(feature);
        }
        for (var i = 1; i <= 200; i++) {
            var coordinates = [120.02 + Math.random(), 30.02 + Math.random()];
            var feature = new ol.Feature(new ol.geom.Point(coordinates));
            source.addFeature(feature);
        }
        for (var i = 1; i <= 200; i++) {
            var coordinates = [120.03 + Math.random(), 30.03 + Math.random()];
            var feature = new ol.Feature(new ol.geom.Point(coordinates));
            source.addFeature(feature);
        }
        for (var i = 1; i <= 200; i++) {
            var coordinates = [120.04 + Math.random(), 30.04 + Math.random()];
            var feature = new ol.Feature(new ol.geom.Point(coordinates));
            source.addFeature(feature);
        }

        // 聚合
        var cluster = new ol.source.Cluster({
            source: source,
            distance: 100
        })

        // 创建图层
        var layer = new ol.layer.Vector({
            source: cluster,
            style: function (feature, resolution) {
                var size = feature.get('features').length;
                var style = new ol.style.Style({
                    image: new ol.style.Circle({
                        radius: 30,
                        stroke: new ol.style.Stroke({
                            color: 'white'
                        }),
                        fill: new ol.style.Fill({
                            color: 'blue'
                        })
                    }),
                    text: new ol.style.Text({
                        text: size.toString(),
                        fill: new ol.style.Fill({
                            color: 'white'
                        })
                    })
                })
                return style;
            }
        });

        // 创建地图
        var map = new ol.Map({
            target: 'map',
            layers: [
                new ol.layer.Tile({
                    source: new ol.source.OSM()
                }),
                layer
            ],
            view: new ol.View({
                projection: 'EPSG:4326',
                center: [120, 30],
                zoom: 10,
                minZoom: 5,
                maxZoom: 14
            })
        });
    </script>
</body>
</html>
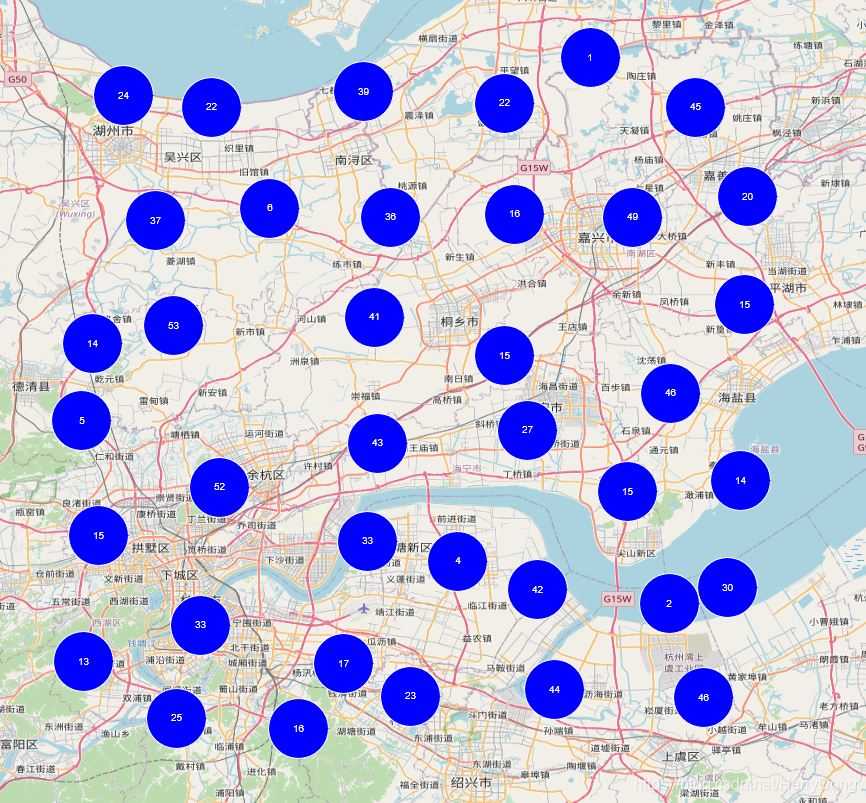
运行效果如图:
聚合特殊处理一
上述代码虽实现了基础聚合,但存在一个明显缺陷:地图缩放层级最大时仍然保持着聚合效果,具体表现如图:
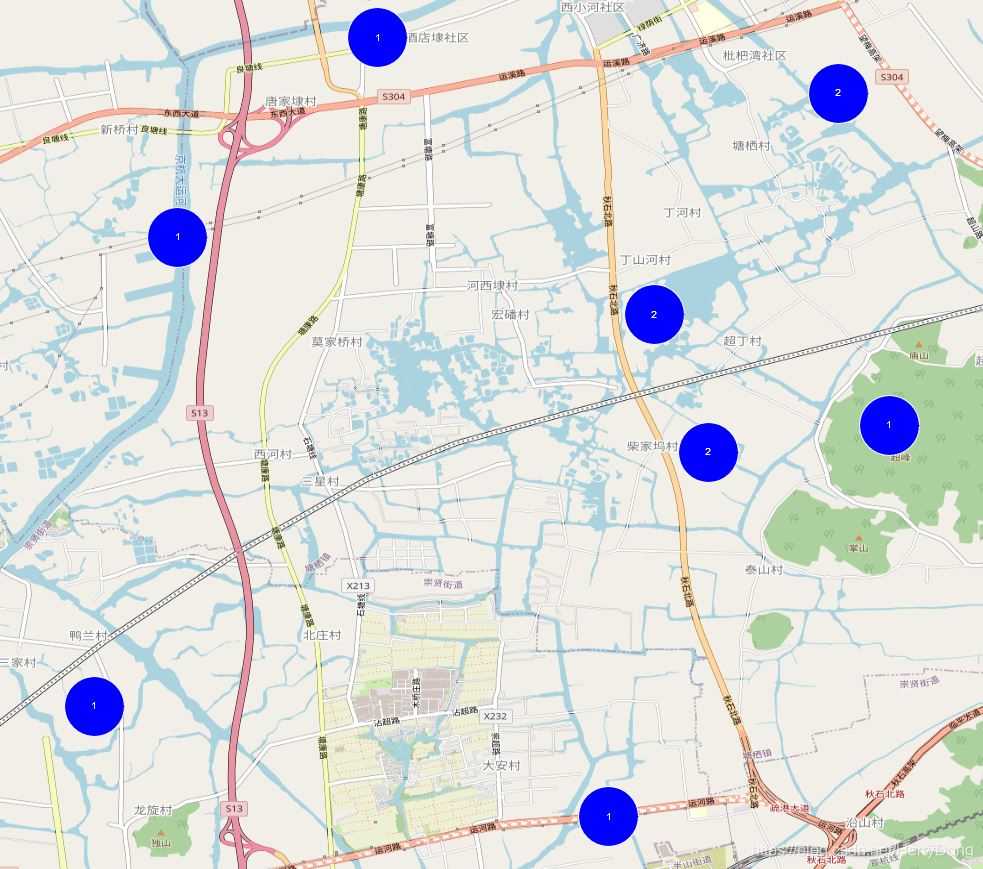
通常,当某处只有一个点时就应该取消聚合效果。为此,我们需要在style: function (feature, resolution)回调函数中编写逻辑,具体代码如:
<!DOCTYPE html>
<html>
<head>
    <meta http-equiv="Content-Type" content="text/html; charset=utf-8" />
    <meta charset="utf-8" />
    <title>OpenLayers</title>
    <style>
        html, body, #map {
            width: 100%;
            height: 100%;
            margin: 0;
            padding: 0;
        }
    </style>
    <link href="libs/ol/ol.css" rel="stylesheet" />
    <script src="libs/ol/ol.js"></script>
</head>
<body>
    <div id="map"></div>

    <script>
        // 随机创建1000个要素
        var source = new ol.source.Vector();
        for (var i = 1; i <= 200; i++) {
            var coordinates = [120.00 + Math.random(), 30.00 + Math.random()];
            var feature = new ol.Feature(new ol.geom.Point(coordinates));
            source.addFeature(feature);
        }
        for (var i = 1; i <= 200; i++) {
            var coordinates = [120.01 + Math.random(), 30.01 + Math.random()];
            var feature = new ol.Feature(new ol.geom.Point(coordinates));
            source.addFeature(feature);
        }
        for (var i = 1; i <= 200; i++) {
            var coordinates = [120.02 + Math.random(), 30.02 + Math.random()];
            var feature = new ol.Feature(new ol.geom.Point(coordinates));
            source.addFeature(feature);
        }
        for (var i = 1; i <= 200; i++) {
            var coordinates = [120.03 + Math.random(), 30.03 + Math.random()];
            var feature = new ol.Feature(new ol.geom.Point(coordinates));
            source.addFeature(feature);
        }
        for (var i = 1; i <= 200; i++) {
            var coordinates = [120.04 + Math.random(), 30.04 + Math.random()];
            var feature = new ol.Feature(new ol.geom.Point(coordinates));
            source.addFeature(feature);
        }

        // 聚合
        var cluster = new ol.source.Cluster({
            source: source,
            distance: 100
        })

        // 创建图层
        var layer = new ol.layer.Vector({
            source: cluster,
            style: function (feature, resolution) {
                var size = feature.get('features').length;
                if (size == 1) {
                    return new ol.style.Style({
                        image: new ol.style.Icon({
                            src: 'img/location.png'
                        })
                    })
                }
                else {
                    return new ol.style.Style({
                        image: new ol.style.Circle({
                            radius: 30,
                            stroke: new ol.style.Stroke({
                                color: 'white'
                            }),
                            fill: new ol.style.Fill({
                                color: 'blue'
                            })
                        }),
                        text: new ol.style.Text({
                            text: size.toString(),
                            fill: new ol.style.Fill({
                                color: 'white'
                            })
                        })
                    })
                }
            }
        });

        // 创建地图
        var map = new ol.Map({
            target: 'map',
            layers: [
                new ol.layer.Tile({
                    source: new ol.source.OSM()
                }),
                layer
            ],
            view: new ol.View({
                projection: 'EPSG:4326',
                center: [120, 30],
                zoom: 10,
                minZoom: 5,
                maxZoom: 14
            })
        });
    </script>
</body>
</html>
运行效果如图:
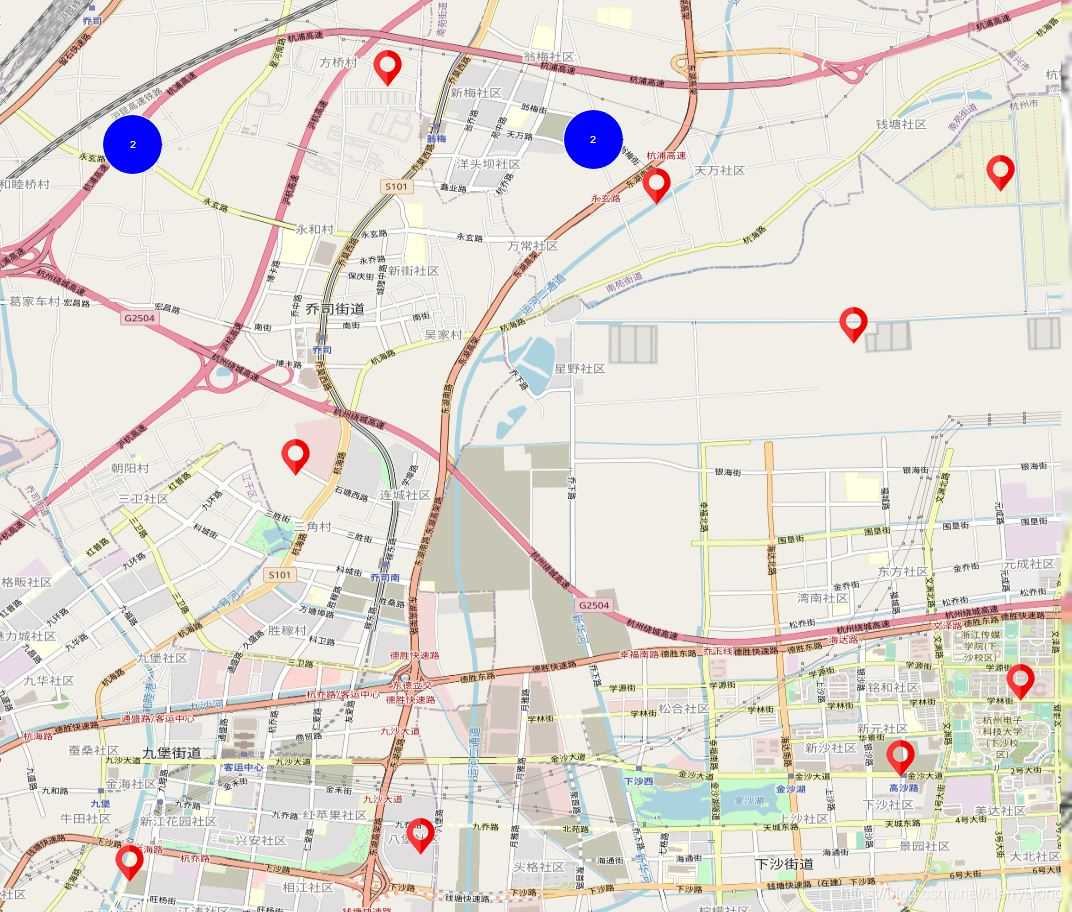
该效果的实现逻辑较为直观,核心在于:var size = feature.get('features').length;。若size>1,则返回聚合后的样式;否则返回单个点的图片样式。
聚合特殊处理二
在前述代码中,地图的最大缩放层级被设定为14,这引发了一个问题:当地图缩放到最大层级时,还有很多点保持着聚合效果。若用户期望:当地图缩放到最大层级时,取消全部聚合效果,则需监听地图事件,实现代码如下:
<!DOCTYPE html>
<html>
<head>
    <meta http-equiv="Content-Type" content="text/html; charset=utf-8" />
    <meta charset="utf-8" />
    <title>OpenLayers</title>
    <style>
        html, body, #map {
            width: 100%;
            height: 100%;
            margin: 0;
            padding: 0;
        }
    </style>
    <link href="libs/ol/ol.css" rel="stylesheet" />
    <script src="libs/ol/ol.js"></script>
</head>
<body>
    <div id="map"></div>

    <script>
        // 随机创建1000个要素
        var source = new ol.source.Vector();
        for (var i = 1; i <= 200; i++) {
            var coordinates = [120.00 + Math.random(), 30.00 + Math.random()];
            var feature = new ol.Feature(new ol.geom.Point(coordinates));
            source.addFeature(feature);
        }
        for (var i = 1; i <= 200; i++) {
            var coordinates = [120.01 + Math.random(), 30.01 + Math.random()];
            var feature = new ol.Feature(new ol.geom.Point(coordinates));
            source.addFeature(feature);
        }
        for (var i = 1; i <= 200; i++) {
            var coordinates = [120.02 + Math.random(), 30.02 + Math.random()];
            var feature = new ol.Feature(new ol.geom.Point(coordinates));
            source.addFeature(feature);
        }
        for (var i = 1; i <= 200; i++) {
            var coordinates = [120.03 + Math.random(), 30.03 + Math.random()];
            var feature = new ol.Feature(new ol.geom.Point(coordinates));
            source.addFeature(feature);
        }
        for (var i = 1; i <= 200; i++) {
            var coordinates = [120.04 + Math.random(), 30.04 + Math.random()];
            var feature = new ol.Feature(new ol.geom.Point(coordinates));
            source.addFeature(feature);
        }

        // 聚合
        var cluster = new ol.source.Cluster({
            source: source,
            distance: 100
        })

        // 创建图层
        var layer = new ol.layer.Vector({
            source: cluster,
            style: function (feature, resolution) {
                var size = feature.get('features').length;
                if (size == 1) {
                    return new ol.style.Style({
                        image: new ol.style.Icon({
                            src: 'img/location.png'
                        })
                    })
                }
                else {
                    return new ol.style.Style({
                        image: new ol.style.Circle({
                            radius: 30,
                            stroke: new ol.style.Stroke({
                                color: 'white'
                            }),
                            fill: new ol.style.Fill({
                                color: 'blue'
                            })
                        }),
                        text: new ol.style.Text({
                            text: size.toString(),
                            fill: new ol.style.Fill({
                                color: 'white'
                            })
                        })
                    })
                }
            }
        });

        // 创建地图
        var map = new ol.Map({
            target: 'map',
            layers: [
                new ol.layer.Tile({
                    source: new ol.source.OSM()
                }),
                layer
            ],
            view: new ol.View({
                projection: 'EPSG:4326',
                center: [120, 30],
                zoom: 10,
                minZoom: 5,
                maxZoom: 14
            })
        });

        // 监听地图分辨率改变事件
        map.getView().on('change:resolution', function (event) {
            if (map.getView().getZoom() == map.getView().getMaxZoom()) {
                cluster.setDistance(0);
            }
            else {
                cluster.setDistance(100);
            }
        })
    </script>
</body>
</html>
运行效果如图:
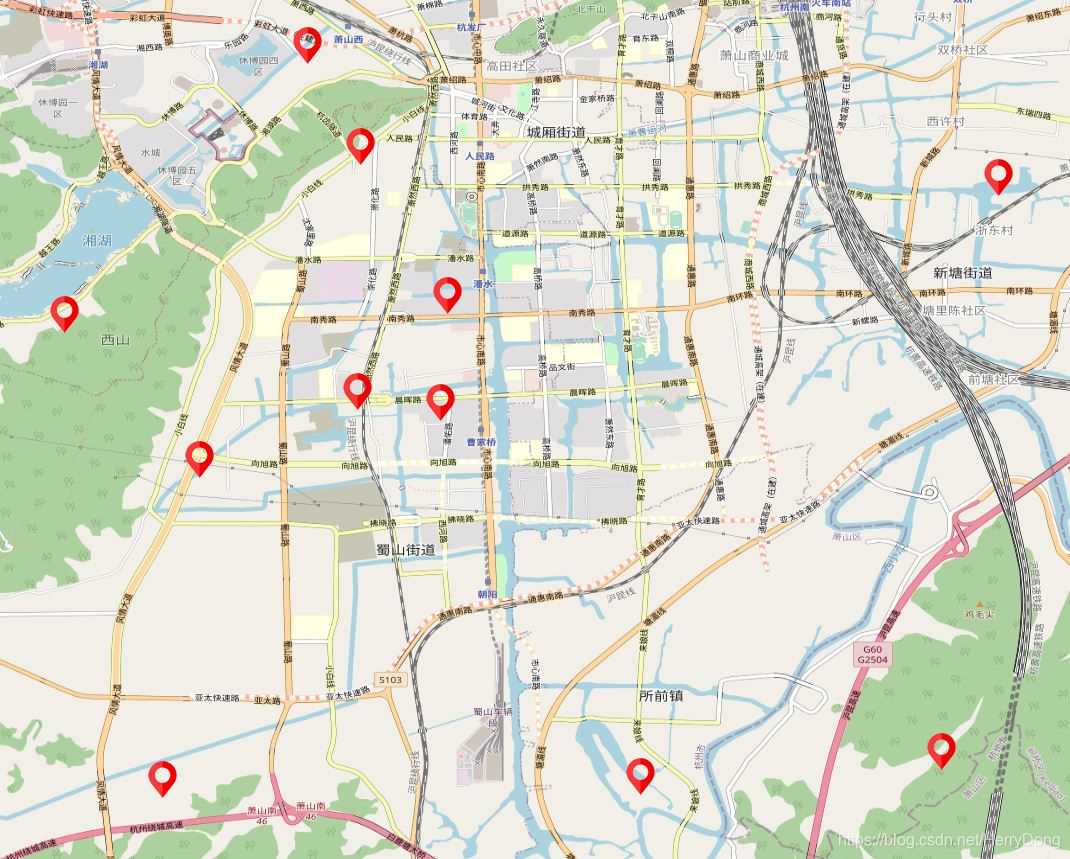
实现此效果的关键在于监听地图分辨率变化事件。当当前缩放层级达到最大值时,将聚合距离设置为0即可解除聚合状态。
结语
在要素数量庞大的场景下,聚合处理不仅能提升用户体验,还能有效避免界面卡顿。在前文示例中,我监听了change:resolution事件,实际上也可以替换为moveend事件,代码如下:
map.on('moveend', function (event) {
    if (map.getView().getZoom() == map.getView().getMaxZoom()) {
        cluster.setDistance(0);
    }
    else {
        cluster.setDistance(100);
    }
});
监听moveend事件同样能达到相同效果,因为地图的缩放和平移操作均会触发该事件。
本文介绍了OpenLayers实现点要素图层聚合显示的方法。更多关于OpenLayers点要素图层聚合显示的内容,请搜索本站历史文章或继续浏览相关文章,感谢大家的支持!
JS表单序列化出现中文乱码怎么解决
2026-11-05 17:21:05
JS代码在线格式化工具推荐:无需安装快速美化
2026-11-05 17:17:49
WebStorm内置JS代码格式化功能怎么用
2026-11-05 10:10:47
在线JS代码格式化与混淆压缩工具推荐及使用指南
2026-11-03 20:31:53
CodePen、JSFiddle与RunJS对比:哪款在线JavaScript编辑器更好用
2026-11-03 18:52:45