

Echarts 横向与纵向柱状图实战:动态切换、自适应与样式定制
本文详解Echarts中横向与纵向柱状图的实现方法,涵盖动态数据按月/日切换、窗口resize自适应处理,以及坐标轴指示器渐变、柱体多色显示、数值标签和自定义Tooltip等高级样式配置,提供完整代码示例。
承接上一篇关于Echarts Bar柱状图样式的详细解析,建议读者先回顾前文内容,当然直接阅读本篇也不会造成太大影响。
横向柱状图
动态更新数据和样式
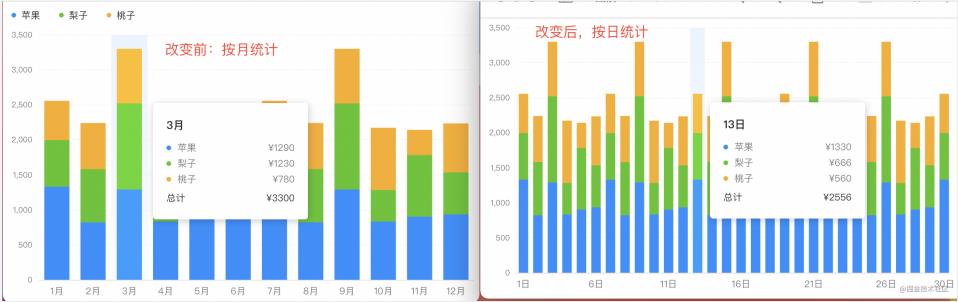
实现数据按月统计与按日统计的动态切换功能。在按月统计模式下,X轴会完整展示12个月份标签;而在按日统计模式下,X轴标签会进行间隔显示,同时柱状体的宽度也会随之调整。这一功能主要依赖于setOption方法来实现。
关于setOption方法的官方文档说明,可参考:echarts.apache.org/zh/api.html…
<script>
  import * as R from "ramda";

  const source1 = [
    ["1月", 1330, 666, 560],
    ["2月", 820, 760, 660],
    ......
    ["11月", 901, 880, 360],
    ["12月", 934, 600, 700],
  ];
  const source2 = [
    ["1日", 1330, 666, 560],
    ["2日", 820, 760, 660],
    ......
    ["29日", 934, 600, 700],
    ["30日", 1330, 666, 560],
  ];

  // 具体配置如之前所示,详细省略,只做基本示例展示
  const initOption = {
    ...
    dataset: { source: source1 },
  };

  export default {
    data() {
      return {
        charts: null,
        isDaily: false,
      };
    },
    mounted() {
      this.charts = this.$echarts.init(
        document.getElementById("barCharts"),
        null,
        {
          renderer: "svg",
        }
      );
      this.charts.setOption(R.clone(initOption));
    },
    methods: {
      handleSource() {
        this.isDaily = !this.isDaily;
        this.charts.setOption(
          R.mergeDeepRight(initOption, {
            // 动态更新数据源
            dataset: {
              source: this.isDaily ? source2 : source1,
            },
            xAxis: {
              // 动态更新标签间隔
              axisLabel: {
                interval: this.isDaily ? 4 : "auto",
              },
            },
            series: R.map(
              // 动态更新柱体宽度
              (o) => ((o.barWidth = this.isDaily ? 12 : 24), o),
              initOption.series
            ),
          }),
          true
        );
        this.charts.resize();
      },
    },
  };
</script>
解决 echarts 宽高自适应问题
在Web项目开发中,图表的宽高往往不是固定的,需要能够根据浏览器窗口的大小进行自适应调整。实现这一功能的关键方法是调用resize接口。当页面中存在多个图表时,需要同时对所有图表执行resize处理以确保显示正常。
<script>
  export default {
    mounted() {
      window.addEventListener("resize", this.handleResize, false);
    },
    destroyed() {
      window.removeEventListener("resize", this.handleResize);
    },
    methods: {
      handleResize() {
        const _this = this;
        const timer = setTimeout(() => {
          _this.lineCharts.resize();
          _this.barCharts.resize();
        }, 500);
        // 清除定时器
        this.$once("hook:beforeDestroy", () => {
          setTimeout(timer);
        });
      },
    },
  };
</script>
纵向柱状图
纵向柱状图实现
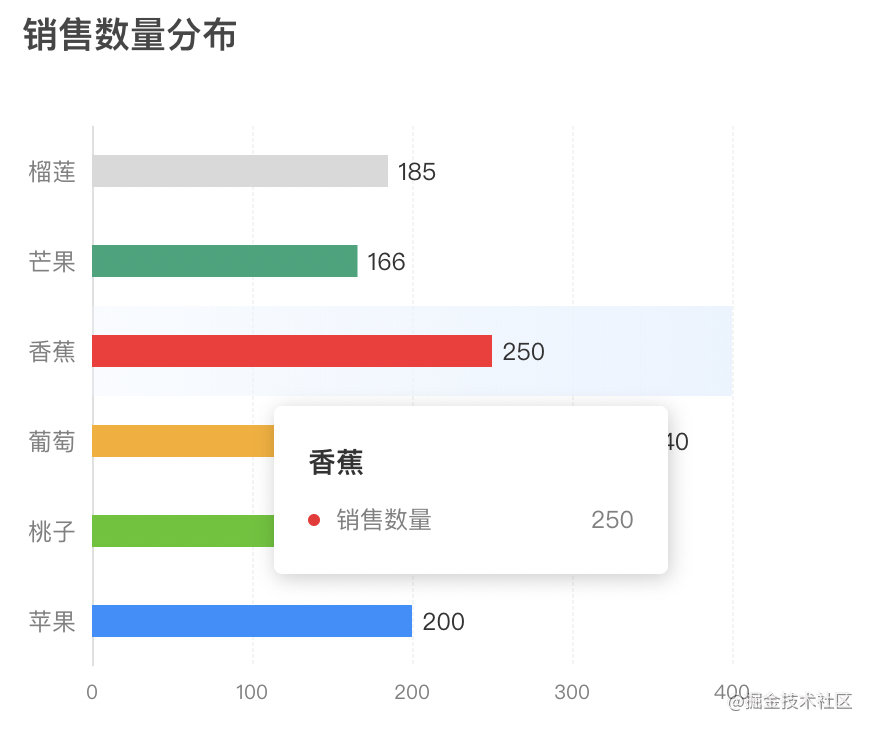
纵向柱状图的实现原理与横向柱状图本质相同,主要区别在于X轴和Y轴数据的互换:X轴对应value(数值),Y轴对应category(类别)。
let option = {
  xAxis: {
    type: "value",
  },
  yAxis: {
    type: "category",
  },
};
坐标指示器背景渐变色
其原理与横向柱状图一致,区别仅在于处理渐变色时X轴和Y轴数值的对应关系发生了交换。
let horizontalColor = {
  type: "linear",
  x: 1, // 更换
  y: 0,
  x2: 0,
  y2: 0, // 更换
  colorStops: [
    { offset: 0, color: "rgba(234,244,255,1)" },
    { offset: 1, color: "rgba(234,244,255,0.3)" },
  ],
  global: false,
};
柱体设置不同颜色
可以通过在series配置中定义color为函数来实现柱体颜色的差异化设置。核心代码逻辑为使用[colorList[params.dataIndex]]来根据数据索引获取对应颜色。
let colorList = [
  "#1890ff",
  "#52c41a",
  "#faad14",
  "#f5222d",
  "#1DA57A",
  "#d9d9d9",
];
let series = [
  {
    type: "bar",
    barWidth: 16,
    itemStyle: {
      // 定制显示(按顺序),实现不同颜色的柱体
      color: (params) => {
        return colorList[params.dataIndex];
      },
    },
    dimensions: ["类型", "销售数量"],
  },
];
柱状图上方显示数值
同样在series配置中,将label设置为函数进行处理。可以自定义数值显示的位置、字体颜色及大小等属性。核心代码通过[params.value[params.encode.x[0]]]获取并显示对应的数值。
let series = [
  {
    // ......
    type: "bar",
    label: {
      // 柱图头部显示值
      show: true,
      position: "right",
      color: "#333",
      fontSize: "12px",
      formatter: (params) => {
        return params.value[params.encode.x[0]];
      },
    },
  },
];
tooltip 提示框自定义
其处理逻辑与横向柱状图类似,但在取值时需注意使用[params[0].axisValue]获取坐标轴值,[item.seriesName]获取系列名称,以及[item.value[item.encode.x[0]]]获取具体数值。
let tooltip = R.merge(tooltip, {
  formatter: function(params) {
    let html = `<div style="height:auto;width:163px;">
          <div style="font-size:14px;font-weight:bold;color:#333;margin-bottom:16px;line-height:1;">
            ${params[0].axisValue}
          </div>
          ${params
            .map(
              (
                item
              ) => `<div style="font-size:12px;color:#808080;margin-bottom:8px;display:flex;align-items:center;line-height:1;">
                <span style="display:inline-block;margin-right:8px;border-radius:6px;width:6px;height:6px;background-color:${
                  item.color
                };"></span>
                ${item.seriesName}
                <span style="flex:1;text-align:right;">${
                  item.value[item.encode.x[0]]
                }</span>
              </div>`
            )
            .join("")}
        </div>`;
    return html;
  },
});
总体实现
charts.setOption({
  title: {
    text: "销售数量分布",
  },
  dataset: {
    source: [
      ["苹果", 200],
      ["桃子", 180],
      ["葡萄", 340],
      ["香蕉", 250],
      ["芒果", 166],
      ["榴莲", 185],
    ],
  },
  xAxis: R.merge(yAxis, {
    type: "value",
  }),
  yAxis: R.mergeDeepRight(xAxis, {
    type: "category",
    axisPointer: {
      shadowStyle: {
        color: horizontalColor,
      },
    },
  }),
  series,
  tooltip,
});
总结
至此,关于Echarts Bar横向柱状图的详细介绍已告一段落。如需了解更多相关内容,建议搜索本站往期文章或继续浏览后续相关文章,感谢大家的支持!
JS转整数出现NaN怎么办?常见异常处理方案
2026-11-05 16:27:31
推荐几款免安装的在线JS压缩工具
2026-11-05 14:54:53
JS怎么使用JSON.stringify实现JSON格式化与缩进
2026-11-04 10:47:30
CodePen、JSFiddle 与 StackBlitz:主流 JS 在线编辑器对比
2026-11-03 21:07:49
JS字符串转数字后怎么正确判断是否为有效数值
2026-11-03 20:04:15